
Command Palette
Search for a command to run...
Liveness Census · HTTP-verified · Daily sweep
The Product Census
We ping every product’s website on a rolling sweep. HTTP doesn’t lie — a 404 is a 404. Of 93,235 products tracked, 90,734 have been probed (97%).
Timeouts, bot-walls, and DNS failures stay in unverified— we never count an unreachable probe as a death.
Responds 200
404 · 5xx · parked
Domain moved offsite
Timeout · bot-wall · DNS
Census Trend — Share of probes per sweep
How the census breaks down over time
Each sweep probes a different slice of the corpus (2K–122K products), so we plot the share of each outcome, not raw counts. 69 sweep-days since May 23.
Observed Transitions — Between sweeps
We watched these flip
Not inferred — observed. Each product below was probed alive on one sweep and something else on the next. Confirmed by the raw HTTP status change, with the date we saw it.











Liveness Model — §6
The four-tier signal ladder
Live site confirmed. First-party activity within the last 6 months. No silence signals detected.
Alive, low-profile. Bootstrapped indie tools live here. Explicitly not a risk tier — silence is a business model.
Activity stale 18 months or more, or funded-then-silent pattern detected. Watch tier — not yet closed.
Closure evidence confirmed: dead URL, GitHub archived, app delisted, or explicit announcement from founders.
Redirected Offsite — Domains that moved
Not dead, but not itself anymore
These products’ domains now redirect somewhere else — a parent company, a marketplace listing, or a for-sale parking page. The site still answers HTTP 200, so the census counts them as redirected, never dead. The destination is where the last probe landed.
Death Model — Cause Taxonomy
What ends products
Classified from 228documented closures with a recorded cause. This is the curated postmortem corpus — the “why” behind deaths, distinct from the live HTTP census above.
Actuarial Model — Kaplan–Meier
Survival curves by category
Kaplan–Meier estimate over 269 documented closures with a known lifespan. The curve is conditional on eventual death— it describes how long failed products lasted, not the odds a live product survives. Half of these closures happened within 4.9 years of launch.
Step function — each drop is one observed closure. Sample is conditional on documented failures, not a random draw, so absolute levels understate real-world survival; the relative ordering between categories is the reliable signal. Only categories with at least four documented closures are drawn.
Death Model — Launch-year cohort
When the dead were born
268 documented closures, grouped by the year each product launched— not the year it died (we record launch year, not an exact death date). Read it as: which launch cohorts are most represented in the graveyard.
Memorial Gallery — Recently Sunset
Products that closed

Learn and help others learn [Tech]
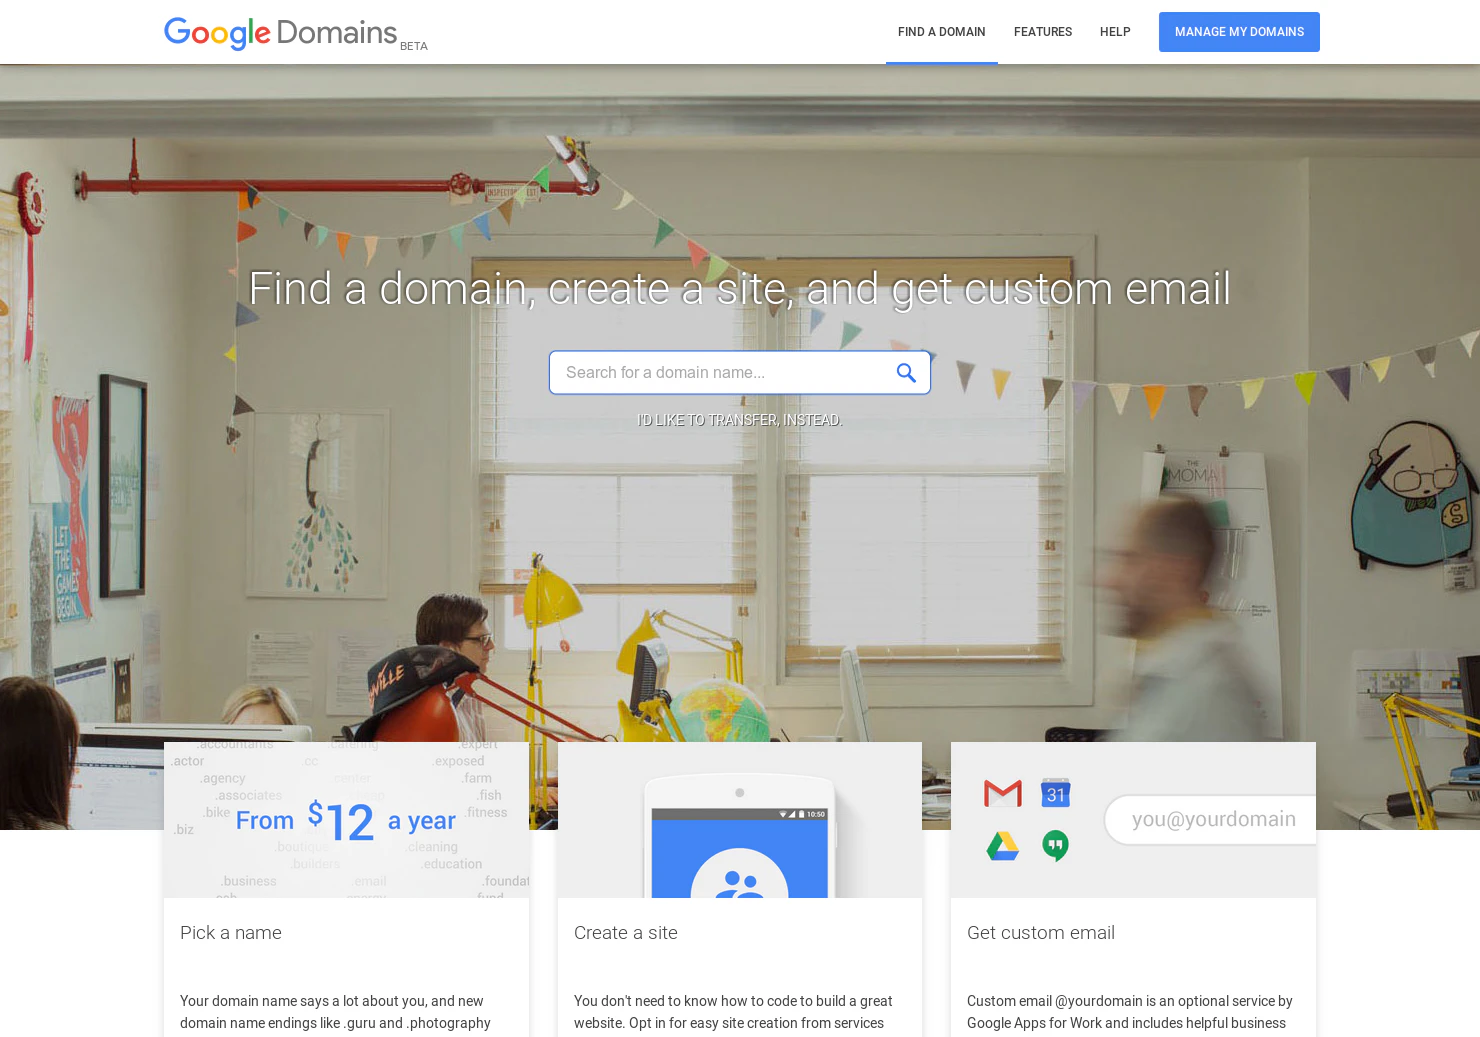
Register and manage domain names with Google [Tech, Search]

Group SMS messaging app that worked across all phones including feature phones. Acquired by Skype…

The first mass-market instant messaging client, predating AIM. Its 'uh-oh' sound became a cultura…
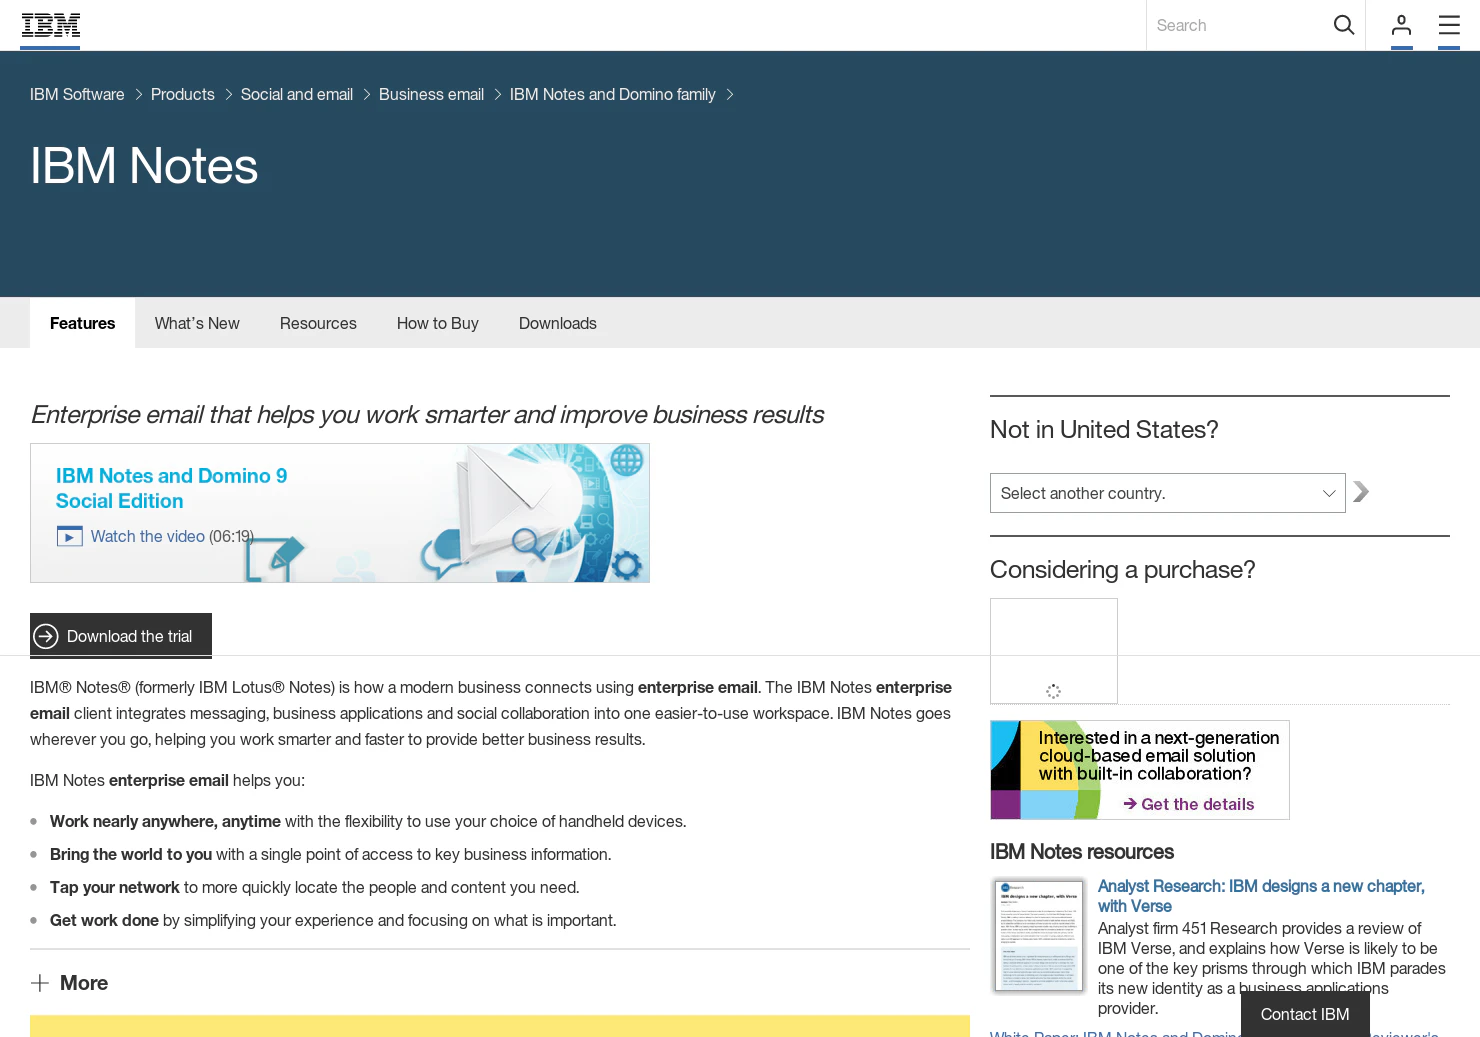
Pioneering groupware platform combining email, calendaring, and database applications. The domina…
Twitter's creator monetization product allowing followers to pay for exclusive content. Launched …
Cloud gaming platform that promised console-quality streaming from any device. Shut down 3 years …
Audio-only social network with invite-only rooms that became a cultural moment during COVID-19 lo…
Killed almost 3 years ago, Grasshopper was a free mobile and web app for aspiring programmers tha…
The AI that could call restaurants to make reservations in a human-sounding voice. Demoed to univ…

Google Glass is back, for the enterprise 🤓 [Hardware, Wearables, Augmented Reality]

Test, adapt, personalize. [Web App, Analytics, Tech]