
Command Palette
Search for a command to run...
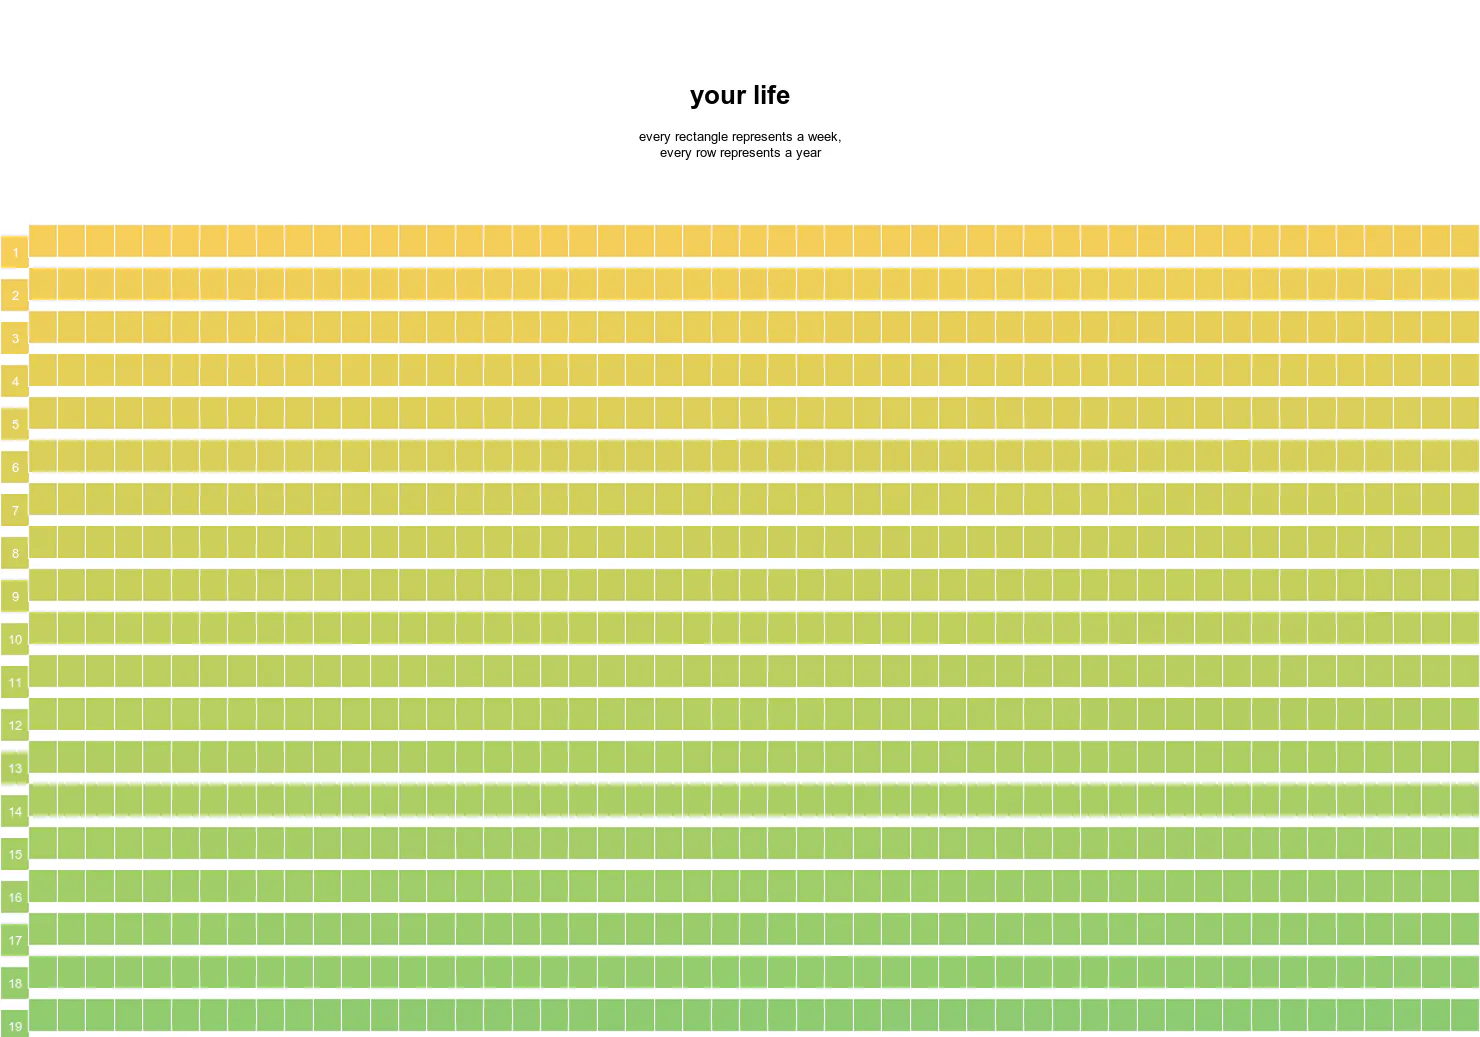
Your life
A life visualization tool that represents each week as a rectangle and each row as a year, offering a unique perspective on time passage and life planning
verified Jul 12, 2026 · HTTP 200
CohortClass of 2016What it is
A life visualization tool that represents each week as a rectangle and each row as a year, offering a unique perspective on time passage and life planning. This minimalist approach helps users see their entire lifespan at a glance and reflect on how they spend their time.
HTTP liveness
9 probes since Jun 16Jun 16Jul 12
AliveHard-dead (404/5xx/parked)RedirectedUnverified (timeout/DNS/block)
Observed events
probes · press · GitHub- Jun 16, 2026First probe — liveAlive · 200 OK
Moat
None apparent
weak · 0.60 confidence
Text classification · Jul 2026
Discussion 0 comments
No comments yet. Be the first!
Pulse Indexobserved activity
9 probes0 pressGitHub –Tranco –
Not enough observed signals for a Pulse Index (needs 2+ signal families).
Cohort survival · Class of 2016weekly
13,657 products launched in 2016 · 100% still active
13,633 active24 sunset
Still active
100%
Median lifespan
4.9y